Cracking Anomaly Detection on System Logs
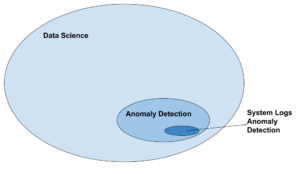
We already know that there is no silver bullet for anomaly detection. But breaking down a subset of the problem into a structured process makes the problem a lot easier. The goal of this article is to give a view of a way to structure the process of Anomaly Detection on System Logs. This concept is obviously related to detection of cyber security threats, but can be also applied to other domains. Before going into the breakdown and modulation let’s look at it from the bird’s view.

Even though this is a small subset of problems, it can have many applications since System Logs are everywhere. Let’s break down the process we will cover:
- The playground – Decide on a sample dataset and generating it
- Parsing – System logs are unstructured by nature, and we need a way to use them
- Modeling – Finding the right model for the use case
- Concluding – What did we learn? What is the next step?
Let’s generate some logs to play with
One easy way to approach this is to look at bootloading logs. When an OS fires up we expect to see some common patterns in the System. We can expect these patterns because software by nature has an “initialization” step. This step is usually deterministic and should happen in a predictable time – when the application starts.
We will create a new VM, and we choose to use Ubuntu 18.04 as the OS. There are many different types of Syslogs in this OS version. Let’s view them:
$ ls /var/log/*.log

/var/log/alternatives.log  /var/log/boot.log  /var/log/dpkg.log  /var/log/gpu-manager.log  /var/log/ubuntu-advantage.log  /var/log/auth.log  /var/log/bootstrap.log /var/log/fontconfig.log  /var/log/kern.log
We are interested only on boot logs so let’s clean up and restart
$ sudo rm -rf /var/log/*.log
$ sudo reboot
Now list the files again:
$ ls /var/log/*.log
/var/log/auth.log  /var/log/boot.log  /var/log/gpu-manager.log  /var/log/kern.log
Okay, we got a bunch of logs that were generated when the System booted. We can run these lines as many times as we like to generate logs. It will be very handy for us.
Generating anomalous behavior
Once we have these “normal behavior” logs. We can optionally generate some “abnormal behavior” – logs that we will later want to detect as anomalous. This part depends on the application. But one easy way to test it is to simply install some demanding applications that run daemons on the OS.
$ sudo apt-get install -y virtualbox docker clamav caffeine neofetch mkchromecast openvpn
Now the boot logs should contain some “anomalous” behavior.
Looking at the data
After a manual examination of the data, we can try to identify patterns and understand some concepts. We will name a few of them:
1. Structure
The Syslogs have some common base structure and each log has a different “content” part. One may fully read about in the Syslog Protocol RFC (there are also a few extra variations of different RFCs). We can generally break it into:
<timestamp> <device> <process> <content>
Aug 20 17:08:18 user-vb systemd-logind[617]: Watching system buttons on /dev/input/event0
2. Substructure
We see that even though the Syslog wrapper is common and defined by RFC, the content part varies between different logs. Sometimes the content part is repeated a few times, for example:
Aug 20 17:08:18 user-vb systemd-logind[617]: Watching system buttons on /dev/input/event0
Aug 20 17:08:18 user-vb systemd-logind[617]: Watching system buttons on /dev/input/event1
Aug 20 17:08:18 user-vb systemd-logind[617]: Watching system buttons on /dev/input/event2
Aug 20 17:08:18 user-vb systemd-logind[617]: New seat seat0.
Here there seems to be 2 sub-structures
Watching system buttons on <>
New seat <>
3. Patterns
Each log is usually followed by another log from the same process that indicates what happens next. We can see with our eyes common sequences of events. See in this kernel log, for example:
Aug 20 17:08:18 user-vb kernel: [0.385120] ohci_hcd: USB 1.1 'Open' Host Controller (OHCI) Driver
Aug 20 17:08:18 user-vb kernel: [0.385122] ohci-pci: OHCI PCI platform driver
Aug 20 17:08:18 user-vb kernel: [0.385551] ohci-pci 0000:00:06.0: OHCI PCI host controller
Aug 20 17:08:18 user-vb kernel: [0.385555] ohci-pci 0000:00:06.0: new USB bus registered, assigned bus number 1
Aug 20 17:08:18 user-vb kernel: [0.385597] ohci-pci 0000:00:06.0: irq 22, io mem 0xf0804000
Aug 20 17:08:18 user-vb kernel: [0.455565] usb usb1: New USB device found, idVendor=1d6b, idProduct=0001, bcdDevice= 5.11
Aug 20 17:08:18 user-vb kernel: [0.455573] usb usb1: New USB device strings: Mfr=3, Product=2, SerialNumber=1
Aug 20 17:08:18 user-vb kernel: [0.455577] usb usb1: Product: OHCI PCI host controller
Aug 20 17:08:18 user-vb kernel: [0.455580] usb usb1: Manufacturer: Linux 5.11.0-27-generic ohci_hcd
Aug 20 17:08:18 user-vb kernel: [0.455583] usb usb1: SerialNumber: 0000:00:06.0
Aug 20 17:08:18 user-vb kernel: [0.455966] hub 1-0:1.0: USB hub found
Aug 20 17:08:18 user-vb kernel: [0.455997] hub 1-0:1.0: 12 ports detected
Ok we are ready to parse the data
1. Parse the Syslog wrapper
Pretty straight-forward, there are many libraries online.
2. Parse the content
This part is not straight-forward – there are multiple ways to address it.
This post was inspired by a few other articles, one of them is the DeepLog paper. The DeepLog utilizes the Drain open source module which extracts from each log it’s “LogKey”. We will explain the meaning of “Log Key” by an example:

The Log Key of a log refers to the string constant that existed in the print statement. In this example
printf("connected to %s", ip_addr)
3. Sessioning
Once the different parts of the logs are parsed, we might also want to separate it into sessions – the difficulty is that there can be multiple layers of sessions
- Different log files (as seen before)
- Different processes
- Different applicative instances, for example TCP sessions
While sessioning can be ignored, it adds an extra layer of knowledge for what happened in the System.
The right model for the application/use case
The goal of the model is to generalize the normal behavior by seeing many samples of it, so when abnormal behavior occurs, it will be identified as anomalous. Choosing the right model depends on what we define as “anomalous”. It highly depends on the application and on the required resolution. Just to give some light on the differences between applications name some examples:
- Cyber security malware detector – This kind of application is probably looking for malicious behavior. So, one possible goal is to search for new patterns that were not seen before. New patterns can indicate that a malware was installed and it is loaded when the system boots.
- Cyber security reconnaissance – For these use cases we might want to search for repetitiveness that was not seen before. It can indicate some discovery, or brute-force attack.
- Predictive Maintenance – For these kinds of applications, identifying performance degradation might be valuable. For example finding out that the boot time increased significantly. Or finding out that there are major system errors.
Modeling it!
We will cover a few possible models that might fit the use case.
- Deep Neural Network (LSTM) – This idea was offered by DeepLog paper as a way to model the hidden patterns of the Log Keys (explained earlier). This derives from the concept where software execution follows code paths. These paths are deterministic in most systems and therefore, by learning which sequences of logs are normal, we can detect deviations from normal execution flags.
- Markov Chain – The idea is similar to the previous proposal, except that the model is simpler and we use the Markov property. Read more about it here.
- Time modeling – By modeling the time where log keys occur. We can find variations from the usual time where an event is reached.
Measuring
This topic is not covered in the article, but even though the model is only learned on “normal behavior” data. It is important to have some “abnormal behavior” data examples for testing the model. And of course using common metrics such as Precision and Recall.
Final words
The goal when writing this was not only to give technical help with Anomaly Detection on System Logs but also to share a view of how to break down the Data Science process, such that the data and business objectives converge. A common mistake is to do a “model first” approach, while in reality the case is usually that the model is just the tip of the iceberg.
Published: August 30th, 2021


